
Comparing R&D Funder Throughput
Back of the envelope style.

Funders each operate at very different points in the R&D value chain. Some like NSF broadly support discovery-based science, others have domain focus like NIH. DARPA and its many ARPA variants run high-risk programs at more translational stages, focused on solving real world needs. Philanthropic foundations operate with a wide diversity of strategies. Venture funds typically invest in companies with proven science and scalable applications. Lean philanthropic allocators like Open Philanthropy and GiveWell move money based on pre-defined outcome metrics. Fast Grants was built to push capital out the door during a crisis.
They all do very different things. Yet many of us feel compelled to compare across them. I don’t think it’s really fair to compare these funders on the basis of strategy. In many ways they’re co-dependent, especially on the basis of deal flow and transitions of their grantees.
But if we take an operational view of these organizations, they share one primary core function that can be a basis of comparison.
They deploy funding. More specifically they deploy funding by using human staff under the constraint of time.
I’ve always found it frustrating that we lack the ability to compare apples to apples across organizations on the basis of how well they deploy funding, especially across fundamentally different types of capital. Part of the issue is that we account for capital differently. Federal agencies have annual budgets. Philanthropies have endowments from which they distribute. Venture capital firms pool funds upfront and deploy them without any specific timeline. Individual philanthropists and family offices often make ad hoc philanthropic decisions.
To have a better means of comparison, we need a metric that treats every funder, public, philanthropic, private, or individual, in the same way. One idea is to consider funding throughput efficiency.
For the sake of this essay, let’s define this as dollars spent per day per person.
This doesn’t tell us whether funding choices are good. It doesn’t measure breakthrough potential, equity, portfolio diversity, or scientific creativity. More on those metrics later. What it does reveal is organizational throughput: how much financial flow a funding organization handles in a fixed unit of time, amortized over their entire staff.
There a few reports on variants of this metric either, to evaluate a single funder or compare across funders. OECD has analyzed administrative burden in research funding across countries. RAND and GAO have studied staffing vs. funding flow at NIH, NSF, and other U.S. agencies. Venture capital economists track capital deployed per partner. GiveWell and Open Philanthropy explicitly discuss dollars moved per staff member in their annual reports. Fast Grants was evaluated partly on its ratio of money deployed to administrative headcount.
But I haven’t really seen a metric that controls for both administrative size and time, and compares across categories of capital in a stack. This can help us at least get some basic insight on a funders’ operational functions across different sectors, geographies, and types of capital. For example it’s not immediately intuitive how a $1B VC fund compares with a federal funding agency with a $200M annual budget. For that we’d need to know relative staff size but also the deployment timelines for the fund.
So here is a first pass. These estimates come from public budget documents, 990s, annual reports, staffing numbers, and reasonable approximations where needed. Some of the numbers are probably inaccurate, or at least not precisely known.
DARPA - $4.1B budget; ~250 staff; figure = 4.1B / 250 / 365.
ARPA-H - $2.5B budget; ~152 planned staff; early-year estimate.
BARDA - $1.7B funding; ~150 staff across divisions.
Fast Grants - $50M deployed; staff <10; throughput intentionally extreme.
NSF - $9.1B appropriations; ~1,500 staff.
ARPA-E - $450M; ~100 FTE.
NIH Extramural - ~$38B extramural; ~4-5K staff.
NIH Intramural - ~$9.5B intramural; ~16-17K lab and clinical staff.
Gates Foundation - $8B annual giving; ~2,167 staff (2023).
Simons Foundation - $300M giving; 500+ staff; internal science footprint reduces throughput.
Open Philanthropy - $750M grants; ~110 staff (2023).
GiveWell - $397M disbursed; ~50-60 staff.
Sequoia Capital - estimated $500-700M annual deployment; ~30-40 investment staff.
Andreessen Horowitz - similar scale; fund deployment over 3-4 years; ~3 dozen investing staff.
Tiger Global - aggressively deploys billions; ~40-50 investment staff at peak.
ARIA (UK) - ~£160M/year (~$200M); ~53 staff.
SPRIN-D (Germany) - €100M/year; ~50-100 staff.
If we do the rough calculations and plot them as a scatterplot of approximate throughput efficiency, we can see some interesting patterns.
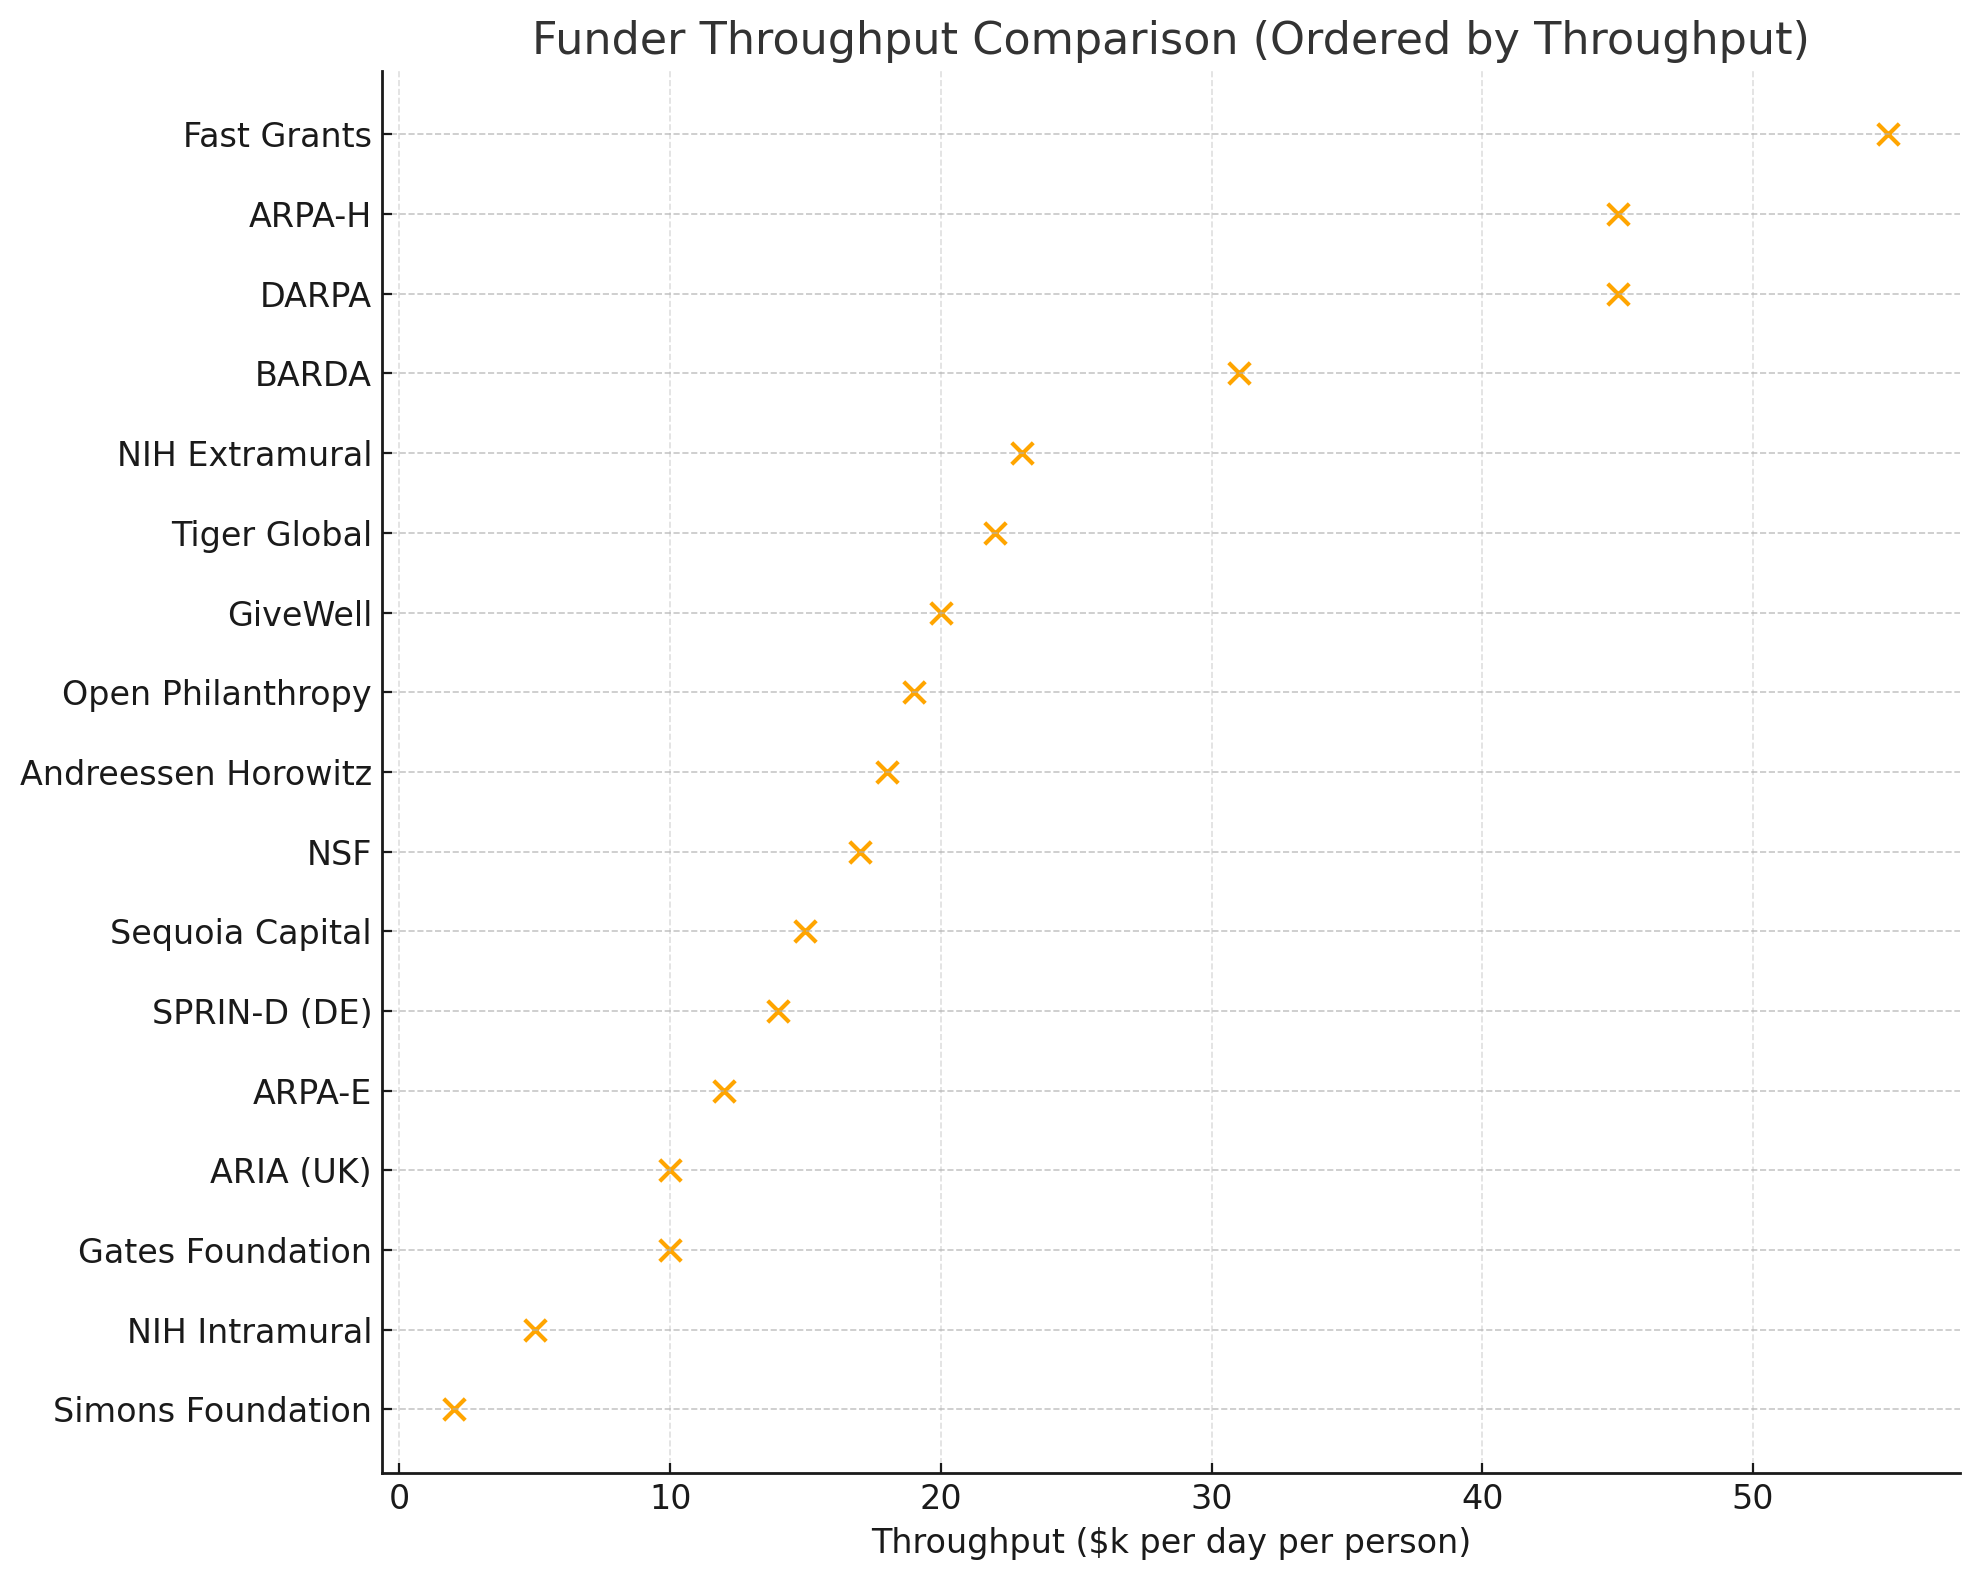
1. ARPA-style agencies sit at the high-throughput end.
DARPA, ARPA-H, and BARDA all land in the $30–45k/day/person range. These orgs typically deploy capital in large chunks and rely on fewer decision-makers to manage programs. And annual budgets often force them to spend down their budget regularly.
2. Mid-band allocators include NSF, ARPA-E, NIH extramural, and lean philanthropies.
These funders cluster around $12–25K/day/person. They run structured review systems, support many small awards, and manage broad portfolios.
3. Large foundations are structurally diverse.
Gates resembles a federal agency in throughput; the Simons Foundation (and many other foundations) looks more like NIH intramural science, reflecting its substantial internal research operations. Open Philanthropy and GiveWell are closer to the mid-band public funders and some venture firms.
4. Venture capital firms look surprisingly similar to lean philanthropic allocators.
Sequoia, Andreessen Horowitz, and Tiger Global deploy large funds with relatively small staff. Their throughput closely matches NSF, Open Phil, and NIH extramural operations. But it’s still far below the ARPA agencies.
5. Fast Grants is an intentional outlier.
Fast Grants was built for crisis deployment with extremely lean staff, so I’m not surprised its throughput per person is extremely high relative to almost any other funder.
What Should Throughput Be?
Just to be clear, I’m not convinced there’s a single right answer here. For that we’d need to factor in mission, funding strategy, and other constraints. But I do think we need a few new examples in the ecosystem that introduce radically higher throughput. One benchmark to look at are capital markets.
Public capital markets have orders of magnitude higher throughput. The New York Stock Exchange daily trading volume is $70–$100b/day, with staff of ~6,000 employees which translates to roughly $12–17m/day/person. It’s not a perfect comparison. There are many more people involved in funding flow in capital markets (including the brokers and agents on either side of transactions, and money often exchanges hands between existing investors, so it’s not really new money. But it is clear that capital markets are designed specifically to create transparency, shared diligence, and lower friction to create high throughput.
Throughput efficiency won’t tell us who funds the most important science, or who generates the greatest societal return. But it does reveal something we almost never quantify: the operational metabolism of the institutions we rely on to move ideas from possibility to reality. And right now, that metabolism varies quite a bit across the stack.
Throughput is not the only metric that matters, nor should it be. But it is one we can measure, compare, and improve. And if we want a healthier, more resilient R&D ecosystem, we need to start treating the flow of capital with the same rigor we apply to the flow of data, talent, and ideas.
This Substack series by Catalyze explores how science can work better to solve our most pressing problems, through new forms of coordination, capital, and intelligence.
If this were a ($/$) metric instead, my guess is that pattern #4 would disappear? Because I suspect VC has higher average staff cost vs grantmakers in government or philanthropy.
My subjective sense from working in 2 out of 3 is that VC is slower throughput per $, but mostly because i) more time spent on fundraising (vs endowments at least) and ii) bizarrely little downward pressure on the denominator (2% management fee felt like a de-facto rule among fund managers)
Ha! You just invented calendar months for operational capacity! It’s a shame that many funding organizations, especially in the federal government, rarely experiment with operational design. This is giving me Monte Carlo vibes to explore throughput optimization and ‘what-if’ scenarios. Interesting.